Although hard to believe, website page speed remains a constantly overlooked and ignored factor for most site owners even today. I mean each one of us knows how important it is, yet there is a strong tendency to take this one easy. Trust me, site speed is directly linked to the success of your site. If you observe, there are tons of websites with immaculate functionalities and innovative designs, still they are far from being profitable. Why?
They end up spending so much energy to leave visitors in awe, completely forgetting the dynamics of the first interaction. How quickly your site pulls up is the very first factor which is detrimental to rest of the user experience. The first few seconds are extremely crucial. What’s the point, if the new visitor is made to wait for a long time? A slow website is the worst first impression that you can ever give to the visitors.
If we talk about it, you can find tons of valuable posts about speed optimization and how it is the most overlooked factor when it comes to site conversion. But, before you start working on these factors, you need to measure your page speed.
That’s the first step in the process.
And that is exactly what we’re going to talk about today. Instead of talking about 5-6 distinct tools and writing one line descriptions, we’ll only talk about two of the most crucial tools that are widely used to analyze web page speed.
GTMetrix
To begin with, GTMetrix is a free tool. You can easily pull up the homepage and start analyzing your website right away.
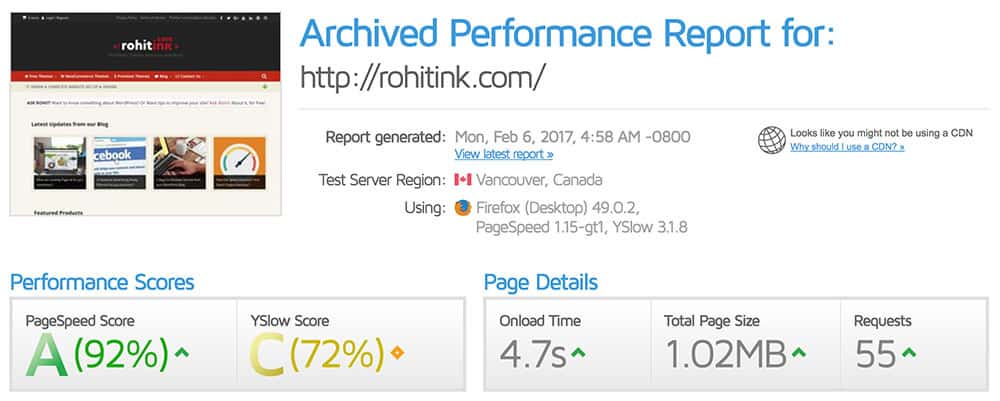
The results that you’d be able to see are PageSpeed Score, YSlow Score, Fully Loaded time, Total Page Size and Requests. It’s not difficult to learn about these metrics. Just hover over to the number and you’ll see how you compare to the overall average across the web.
Now if you’re looking to gauge the overall performance, you need to dig a little deeper. We’re referring to the column below these numbers. Let’s take a look at the parameters listed here.

PageSpeed/YSlow
The recommendations here are already sorted in order of impact (to site speed). Also, the corresponding sections to these recommendations can give you further information.

You can apply each of these hacks and check the overall affect on the page speed. With tools like these, the complex graphical representation can actually confuse the best of technical pros.
That’s why, you should only concentrate on reducing the overall load speed. That’s it. For most users, it is not recommended to get onto the nitty-gritty of the game. A lot of these data points depend upon many factors on the website (like design), which is sometimes more important for your overall business and out of your hands.
Tip: Stick to the simple recommendations. If needed, take help from experts in the field. If your GTMetrix score is above 85, you are doing great!
Waterfall
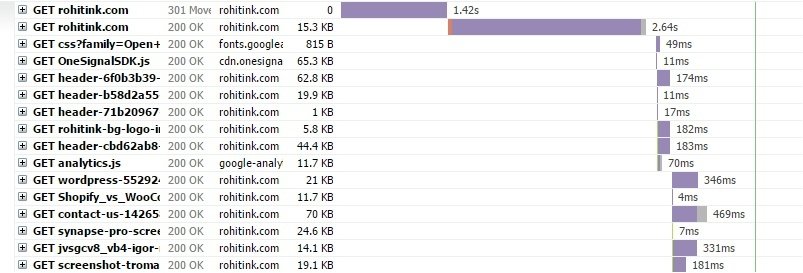
Although, it is very much a detailed topic, we’ll talk about the basics here.
As you can see, each important asset on the website is analyzed in detail here. Each section represents a bar; and each bar in the waterfall representation shows how much time the particular asset took. The idea here is to carefully analyse each asset. Honestly, it is a technical process that requires a good understanding of the waterfall charts.
In a nutshell, if the score of an asset is on a higher side, it’s a hint for the owner to optimize it.
Others
Other sections like timings, video, history are for premium users. As this article talks about everything that you can get for free, we are going to skip the sections. Note: Among all these premium features, the history tab gives you a very easy representation of all the results from various assets on a single page. It then becomes quite a useful feature.
Google PageSpeed Insights
Google Pagespeed analyzes your website to decide upon the major issues related to webpage loading times. As this tool comes from the mothership Google, each piece of data is fool proof and becomes all the more important.
When you visit the website, just put your URL in the box and click enter. You will see a score out of 100, which is calculated keeping in mind the various page speed factors that are known to cause slow loading time for most websites. Here is what the stats for rohitink.com look like.
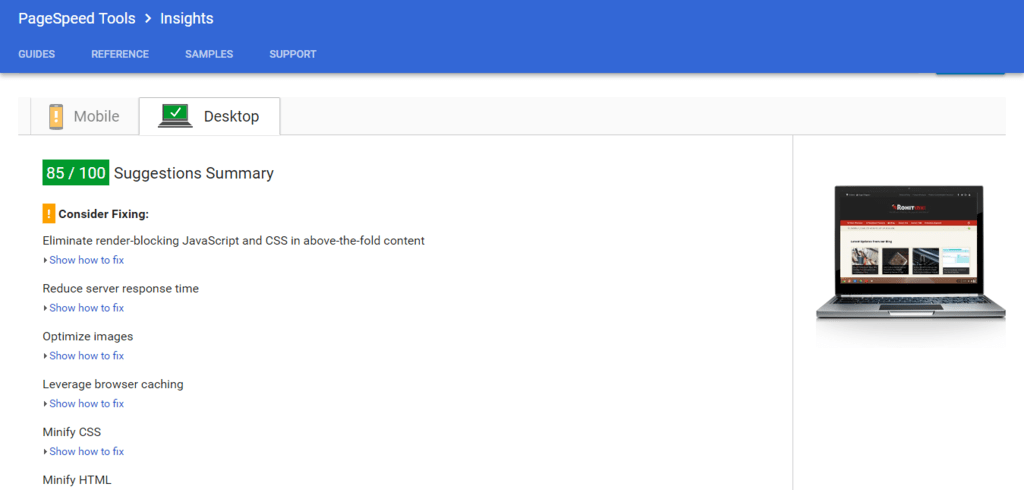
As it is really crucial to monitor the loading times for all kind of devices, you’ll see separate scores for mobile and desktop versions of your website.
When you get the results, notice the scores on every factor that affects the speed of your website. The next step is to click on the text highlighted with the message “show how to fix“.

Just follow those instructions and you’re good to go. All of these results are already prioritized according to the impact on your website speed. It really is a simple process. Keep a schedule wherein you check the page speed often. As they say, the best way to improve anything is to measure it first.
Google Page Speed is a relatively strict tool, and if you achieve a score over 70, you should be content. Because Google often wants you to compromise with site quality and user experience to get a higher pagespeed score. For example, we use things like Newsletter Optins, Facebook Like Boxes, Social Share Icons, Google Analytics, etc. These are often provided by 3rd party and implemented with their API. There is a limit to which we can optimize these. Look at the scripts which google is recommending me to leverage browser caching for:
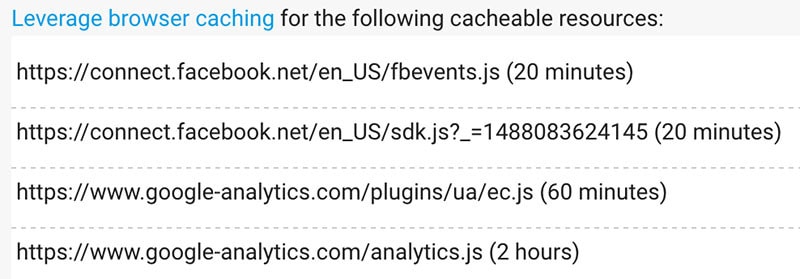
These are external scripts, and I can not host them locally and thus can not control them. So, these are the things I tend to ignore.
DotCom Tools
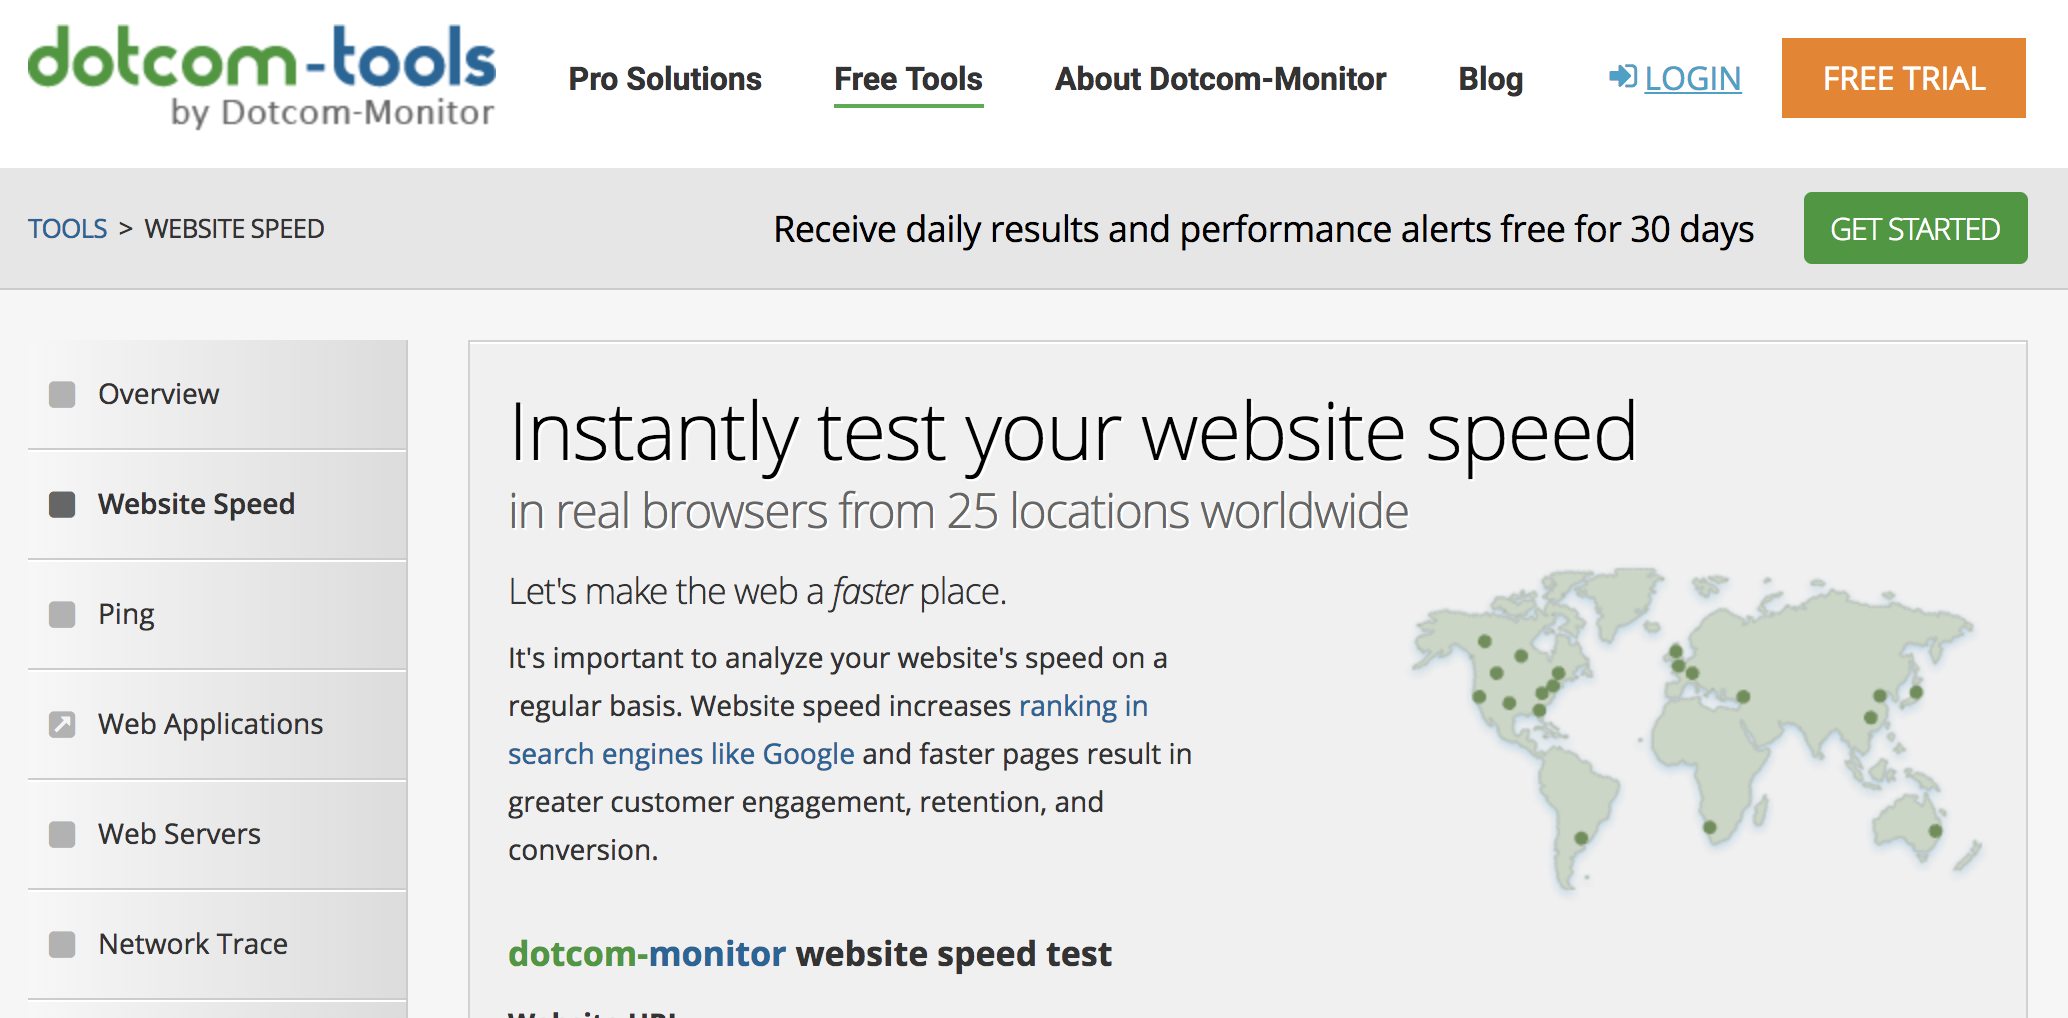
Dotcom Tools provides free website speed tests where you can instantly test your website from 20+ locations around the world, utilizing real browsers just as an end-user experiences your website. Some of the Features there free testing provides
- Browser-based load time testing of all page elements
- Detection of slow/missing elements
- Test via Chrome, Firefox, IE and mobile web browsers
- Complete waterfall report, charts & graphs
- Results from nearly 2 dozen global locations
- Absolutely Free – no sign-up required
They also have pro tools which lets you do more and advance testing like Real Time Load Testing. This could be really useful if you are preparing your web server for high traffic situations.
Conclusion:
Honestly, page speed is the number one factor which significantly affects your online business. Any serious site owner should extensively test each corner of the website to ensure the visitors have a pleasant stay. Truth is, nobody has the patience to wait for a website that doesn’t load up right away.
There is no denying that there are hundreds of other free and paid tools that you can work with. However, the amount of information that GTMetrix and Google PageSpeed offer without any charge, makes them ‘too hot to ignore‘. In fact, they should be part of every website owner’s toolbox.
So, how fast does your site load? Do you have a secret page speed tool, that you’d like to recommend? Any innovative thoughts?
Do let us know in the comments. Best of luck.


I was actually taking page speed for granted before ever since I started my blog last December and it was only around 2 days ago when I tried to check it in Google Pagespeed Insights. The result was really disturbing because my initial score was 17/100 on desktop, and as a webmaster, I really felt guilty about it. but now I have already made some tweaks and its now at 89/100. Please feel free to read my post and comment on how I did it here.
I was wondering, why my blog is loading this much slow, but after reading this post, i came to know all doubt regarding my blog, thanks man for this post.